Have you ever wanted build free graphs or charts using open-source in Java? Well it turns out that you can build free Java graphs and charts with JFreeChart!

As the author of marrspoints.com, I have often thought of bringing some of the statistics to life with some graphs and charts. The main issue I faced was they needed to work with Java, and they needed to be free and open-sourced. After considering a few other options, I landed on JFreeChart written by David Gilbert. David maintains a blog but it, like the JFreeChart documentation is somewhat out of date. More on that in a bit – as there must be a reason I still chose it for marrspoints!
I originally developed marrspoints.com in 2015 and have continued to update it with some SEO and then some statistics in April of 2016 and more recently the Bracket Racing program (a very different type of class) in April of 2018. Oddly I am writing this post in April of 2020 (which included the graphs of which I will discuss).
Advantages of Graphs and Charts with JFreeChart
The main advantages I found with JFreeChart were my key requirements:
- Written for Java and works with Java 8
- Free and Open-Source
- It has some documentation (not free and not up to date)
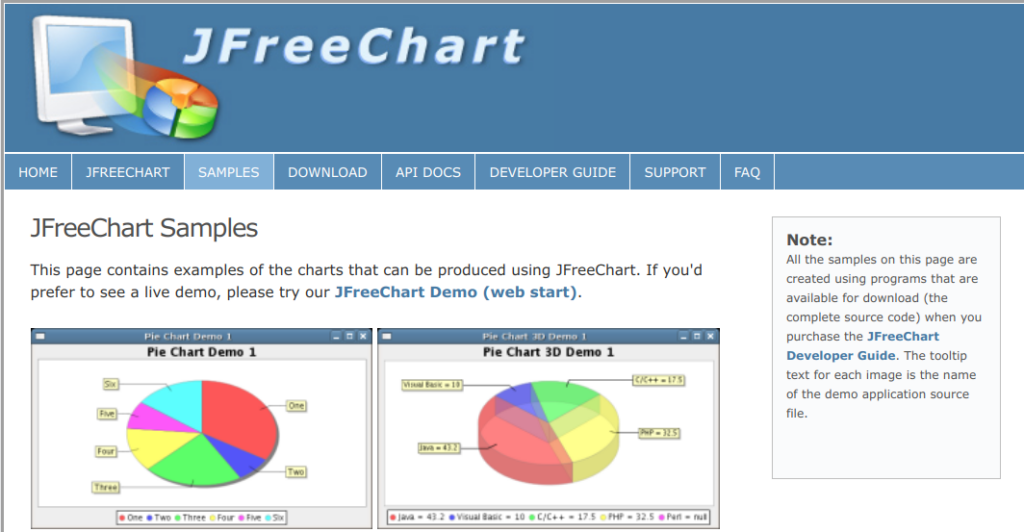
- It has a huge library of ready-made samples (not free)
- Works with Java WebApps – specifically Tomcat 8
Since it comes as a Java Jar file, I decided to go ahead and buy the documentation for about $55 USD. The first thing I noticed was that the PDF file was for the 1.0.19 version and not the current 1.5 version. This was worrisome. However, David’s blog pointed out that the documentation also gave you a complete sample set of charts in a jar file, and instructions to run it.
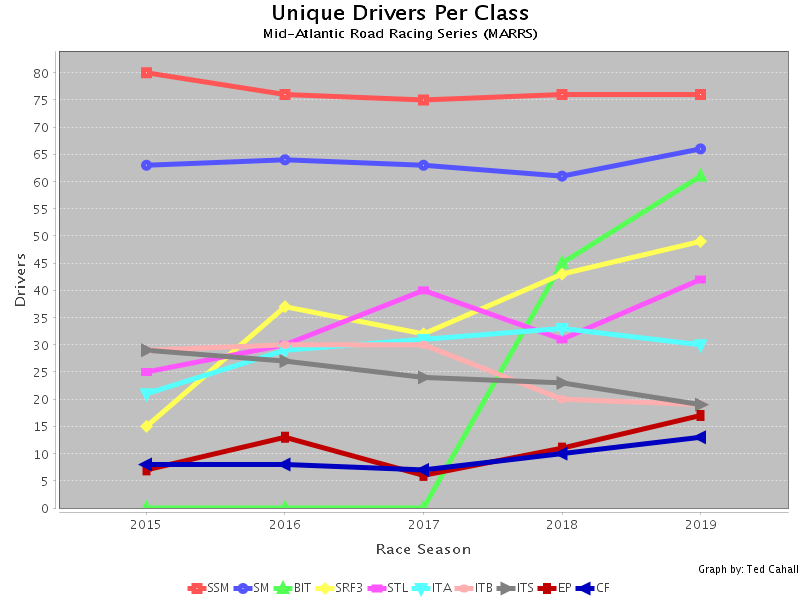
Between the documentation and the sample set of 300 graphs, it was fairly easy to make quick progress. The documentation gave me enough clues to make a Java Servlet that created a PNG with a summary chart. There is a sample app that allows simple clicking through the 300 sample graphs and charts to allow selection of various features for chart type, legend manipulation, axes control, titles, subtitles, etc. Combining these two elements, I was able to pull together four graphs of three different chart types fairly quickly. My first chart follows.

Disadvantages of Graphs and Charts with JFreeChart
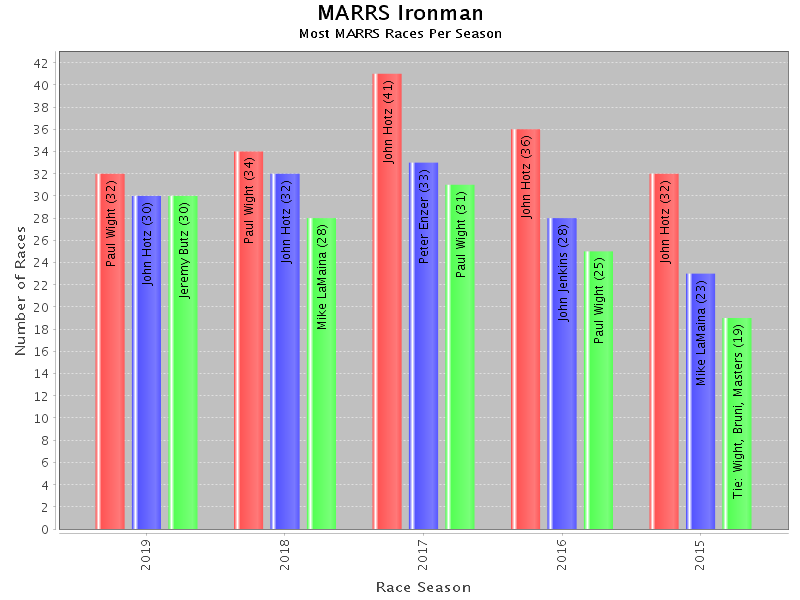
As previously mentioned JFreeChart is not totally free if you want the documentation and the sample charts. But to me, they are totally worth $55 USD. Also as mentioned, the documentation is not current for version 1.5 – but it was good enough in the sections I needed to help me create Java Servlets that produced a PNG image. The sample charts are well worth the money and helped me craft custom charts such as the bar chart below.

It would have been nicer if the documentation was up to date. It also would make me feel a bit better if there were updates post 2017 to this project by David. But it works great and is mostly free. David also has other newer SVG graphs, JS graphs and a whole new charting library. But this one worked well enough for marrspoints.com.
Conclusion of Graphs and Charts with JFreeChart
Hopefully this short article has helped you see that you can build some free Java based graphs and charts with JFreeChart.