Zabbix is an open source system monitoring and alerting tool. Even running a home data center requires monitoring the status of the equipment. When there is an issue, it needs to alert folks that things are not working correctly.
Ted Cahall uses Zabbix for Monitoring and Alerting
As I have mentioned, I run several Linux servers at home and in the AWS cloud. This is great – but it could become a nightmare to know when servers are having issues. Enter Zabbix – it is free and comes included in most Linux distributions. So it is a natural choice for monitoring Linux servers. Another great feature is that is can monitor Windows machines and Macs as well.
High Level Zabbix Overview
Zabbix is written in PHP and stores its configuration, monitoring, and alert data in a MySQL database. All of these are also free and included in Linux distributions. I would recommend adding the Zabbix repo to your package manager for each of your Linux machines. The agent version currently supported in Ubuntu 16.04 LTS is on 2.4.7 as of this blog post. Where as I selected version 3.0 in the repository. Those Linux machines are currently running version 3.0.16 and get updated as the code is updated at Zabbix.
Zabbix uses a server to collect the data and store it in MySQL. It also uses “agents” to run on each of the monitored machines. The agents are further configured to monitor certain aspects of each of the Linux machines on which they run. Zabbix monitors CPU, Memory, bandwidth, context switches, etc. right out of the box for most Linux machines without configuration.
Running in Cahall Labs
Currently I have the agents monitoring the MySQL DBs on some of the Linux servers as well as the Apache web servers and Tomcat app servers. I am also monitoring my Cassandra and Hadoop clusters. An interesting open source feature I found is the ability to monitor my various APC UPS power back-ups. Now I know if one is getting sick or when they go offline onto battery mode. This is useful when I am not at home to know the power has gone out. The agent can also be configured to monitor a Java JVM though its JMX gateway.
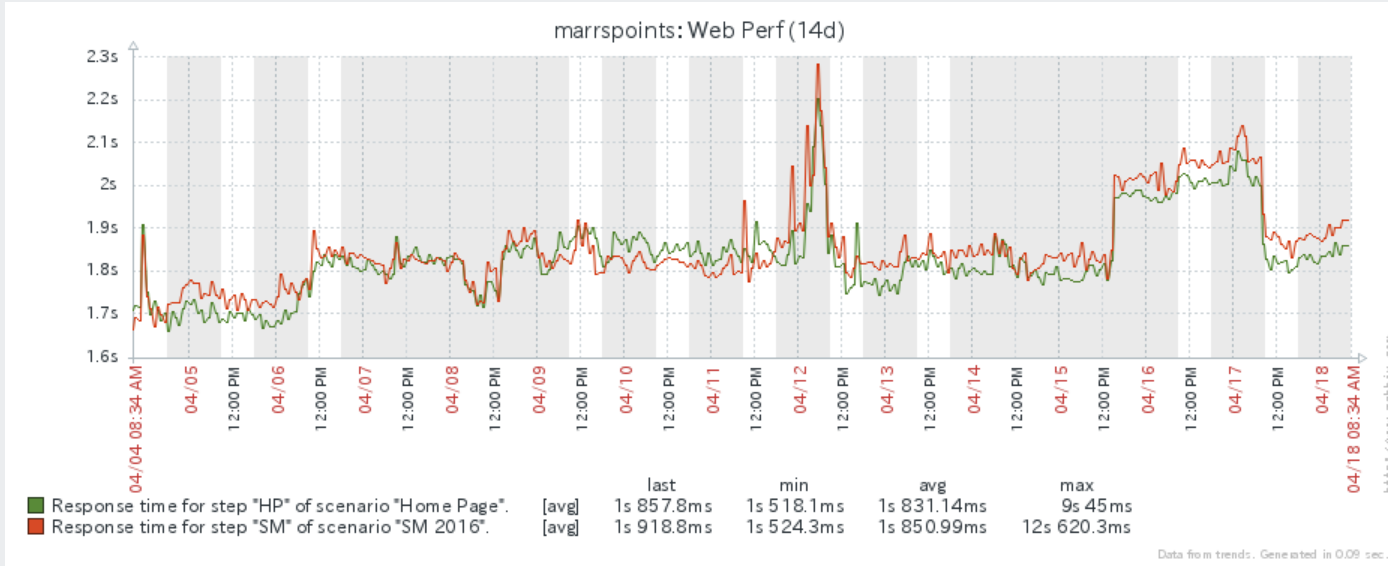
I also monitor my Synology NAS servers and my older NetGear NAS with Zabbix. The AWS production instance of marrspoints.com is monitored for uptime and page load performance (see graph below) from my home data center. I also track and graph the number of drivers being tracked in marrspoints. Its built in data graphing of is very useful.

Zabbix can scale to thousands of servers and has a proxy feature to help offload the main server. We used Zabbix at my previous company and monitored thousands of servers in AWS as well as our private cloud. The auto-discovery feature allowed us to locate new VMs and automatically add them to the monitoring and alerting framework. Zabbix is shipping version 3.4. I have note tested beyond 3.0 at this time.
Alerts
Zabbix can alert you when something has exceeded a pre-configured threshold. For a home data center, this may be challenging as it was not clear it would simply use a Gmail account as the outbound sender. I overcame this issue by adding a SES account to AWS. This allows my Zabbix server to connect to the AWS SES server and send outbound alert emails to my personal email accounts. See sample email alert via Amazon SES below:

It also supports sending SMS text messages as alerts. However, I have not implemented that feature due to the costs of the SMS service. Email is good enough for my home data center.
Ted Cahall highly recommends Zabbix!
In summary, I find there is very little I cannot accomplish with Zabbix for my home data center (or for the Hybrid clouds at my previous employer). With some innovative thinking, I have seen everything from room temperature to number of people coming or going through an automated gate measured.
If there is a way to get the data back to a Linux server, there is a way to monitor and alert it from Zabbix. It is the Swiss Army knife of systems monitoring tools – and it is FREE!
